

Infographics/Technical Drawings
Here are a variety of diagrams, technical drawings, project timelines and some infographics.
Clarifying data and showing it in an easy-to-understand way, that’s what I can do for your project.
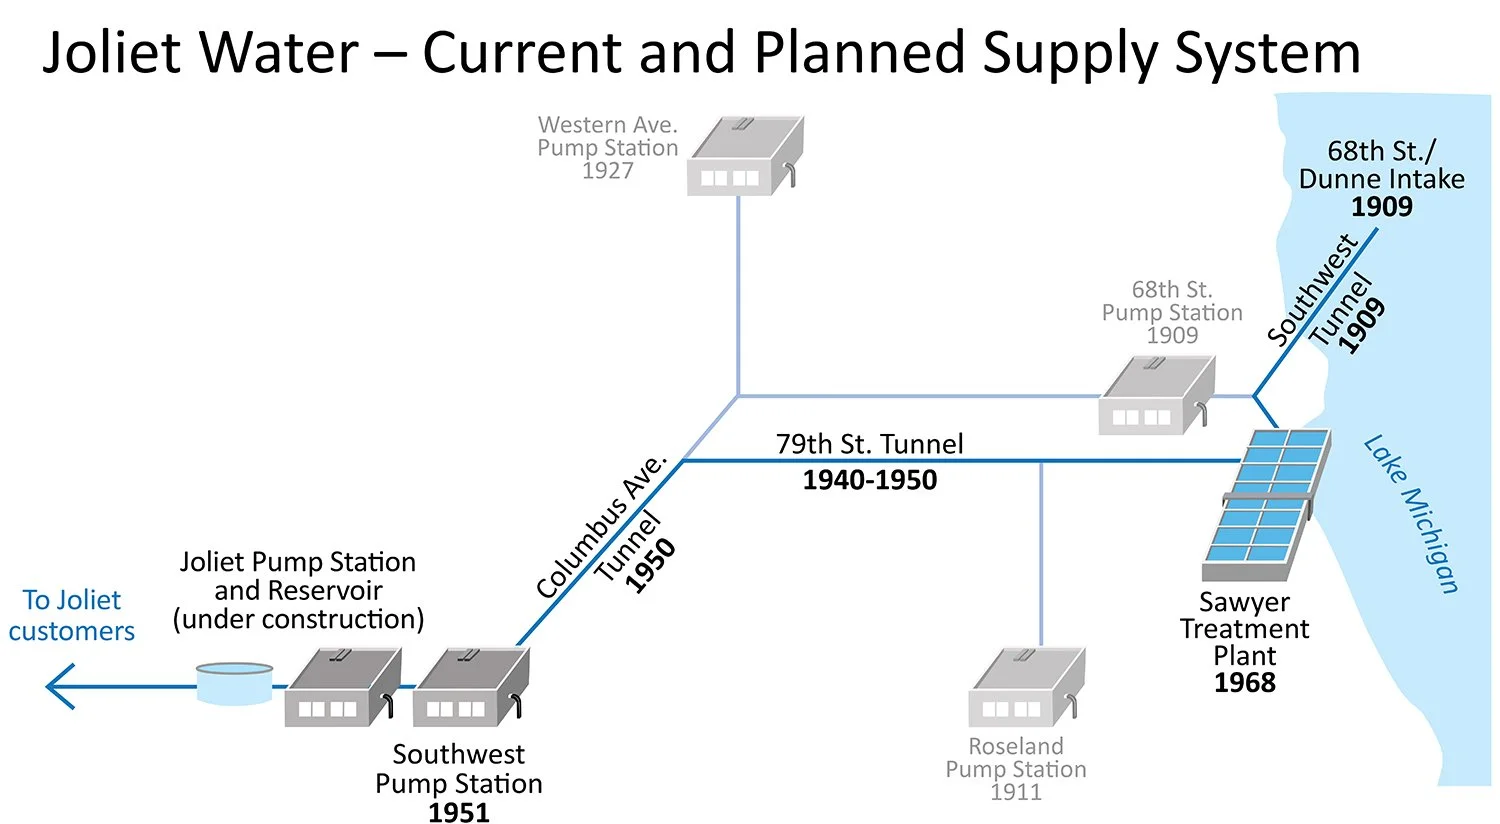
Map /infographic. The Joliet Water System in Chicago is updating its water supply system. This is a simplistic diagram I created to show the original jumpstations and those that are planned. Client: Consor .

Map /infographic. This is a good example of taking a complicated and making it easy to understand with illustrations. For the City of Hillsboro, it illustrates their Sanitary Sewer System. The residents get bills from both the city and Rock Creek so this is intended to explain how the two systems work.
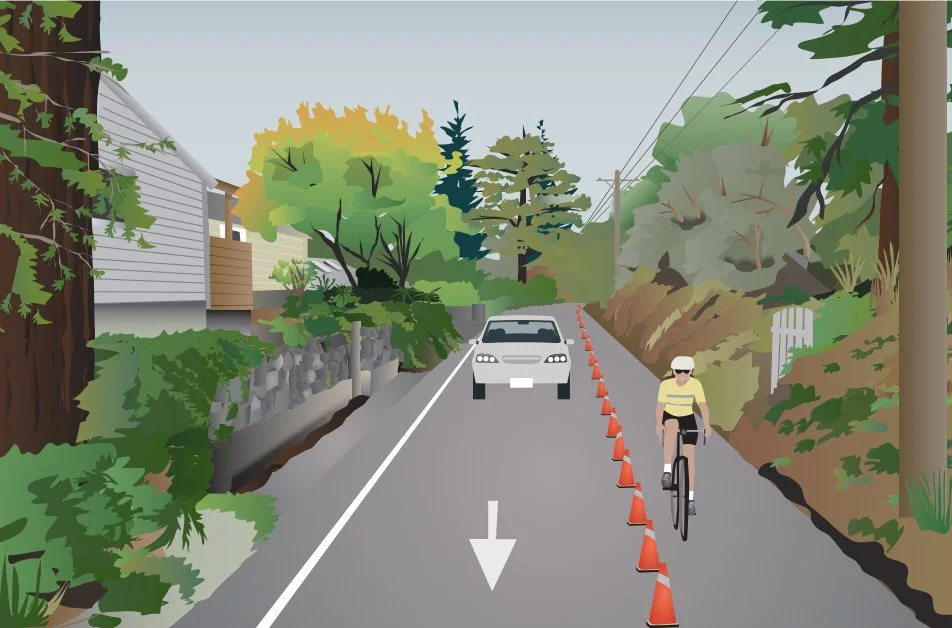
Visual Simulation. This is a drawing I created of how a street would look with an added bike path. For an engineering firm.

Bridge Sequencing Simulation This was part of a proposal I helped Stacy and Witbeck prepare. It’s a cross section and aerial view showing how a bridge across the freeway would be built out. I drew all the pieces of equipment!
Create easy-to-understand technical diagram
Original illustrations
RTP vs STIP Process This infographic is showing the different steps by each municipality, one is Metro, the regional transportation planner and the other is ODOT, the state planner.